Appearance
Combining MACD and RSI for More Powerful Trading Signals
Overview
MACD spots momentum shifts and trend direction; RSI measures the strength and “speed” of moves. Combining them helps filter false signals and time entries with better probability across crypto, gold, FX, and equities.
What each indicator does (quick refresher)
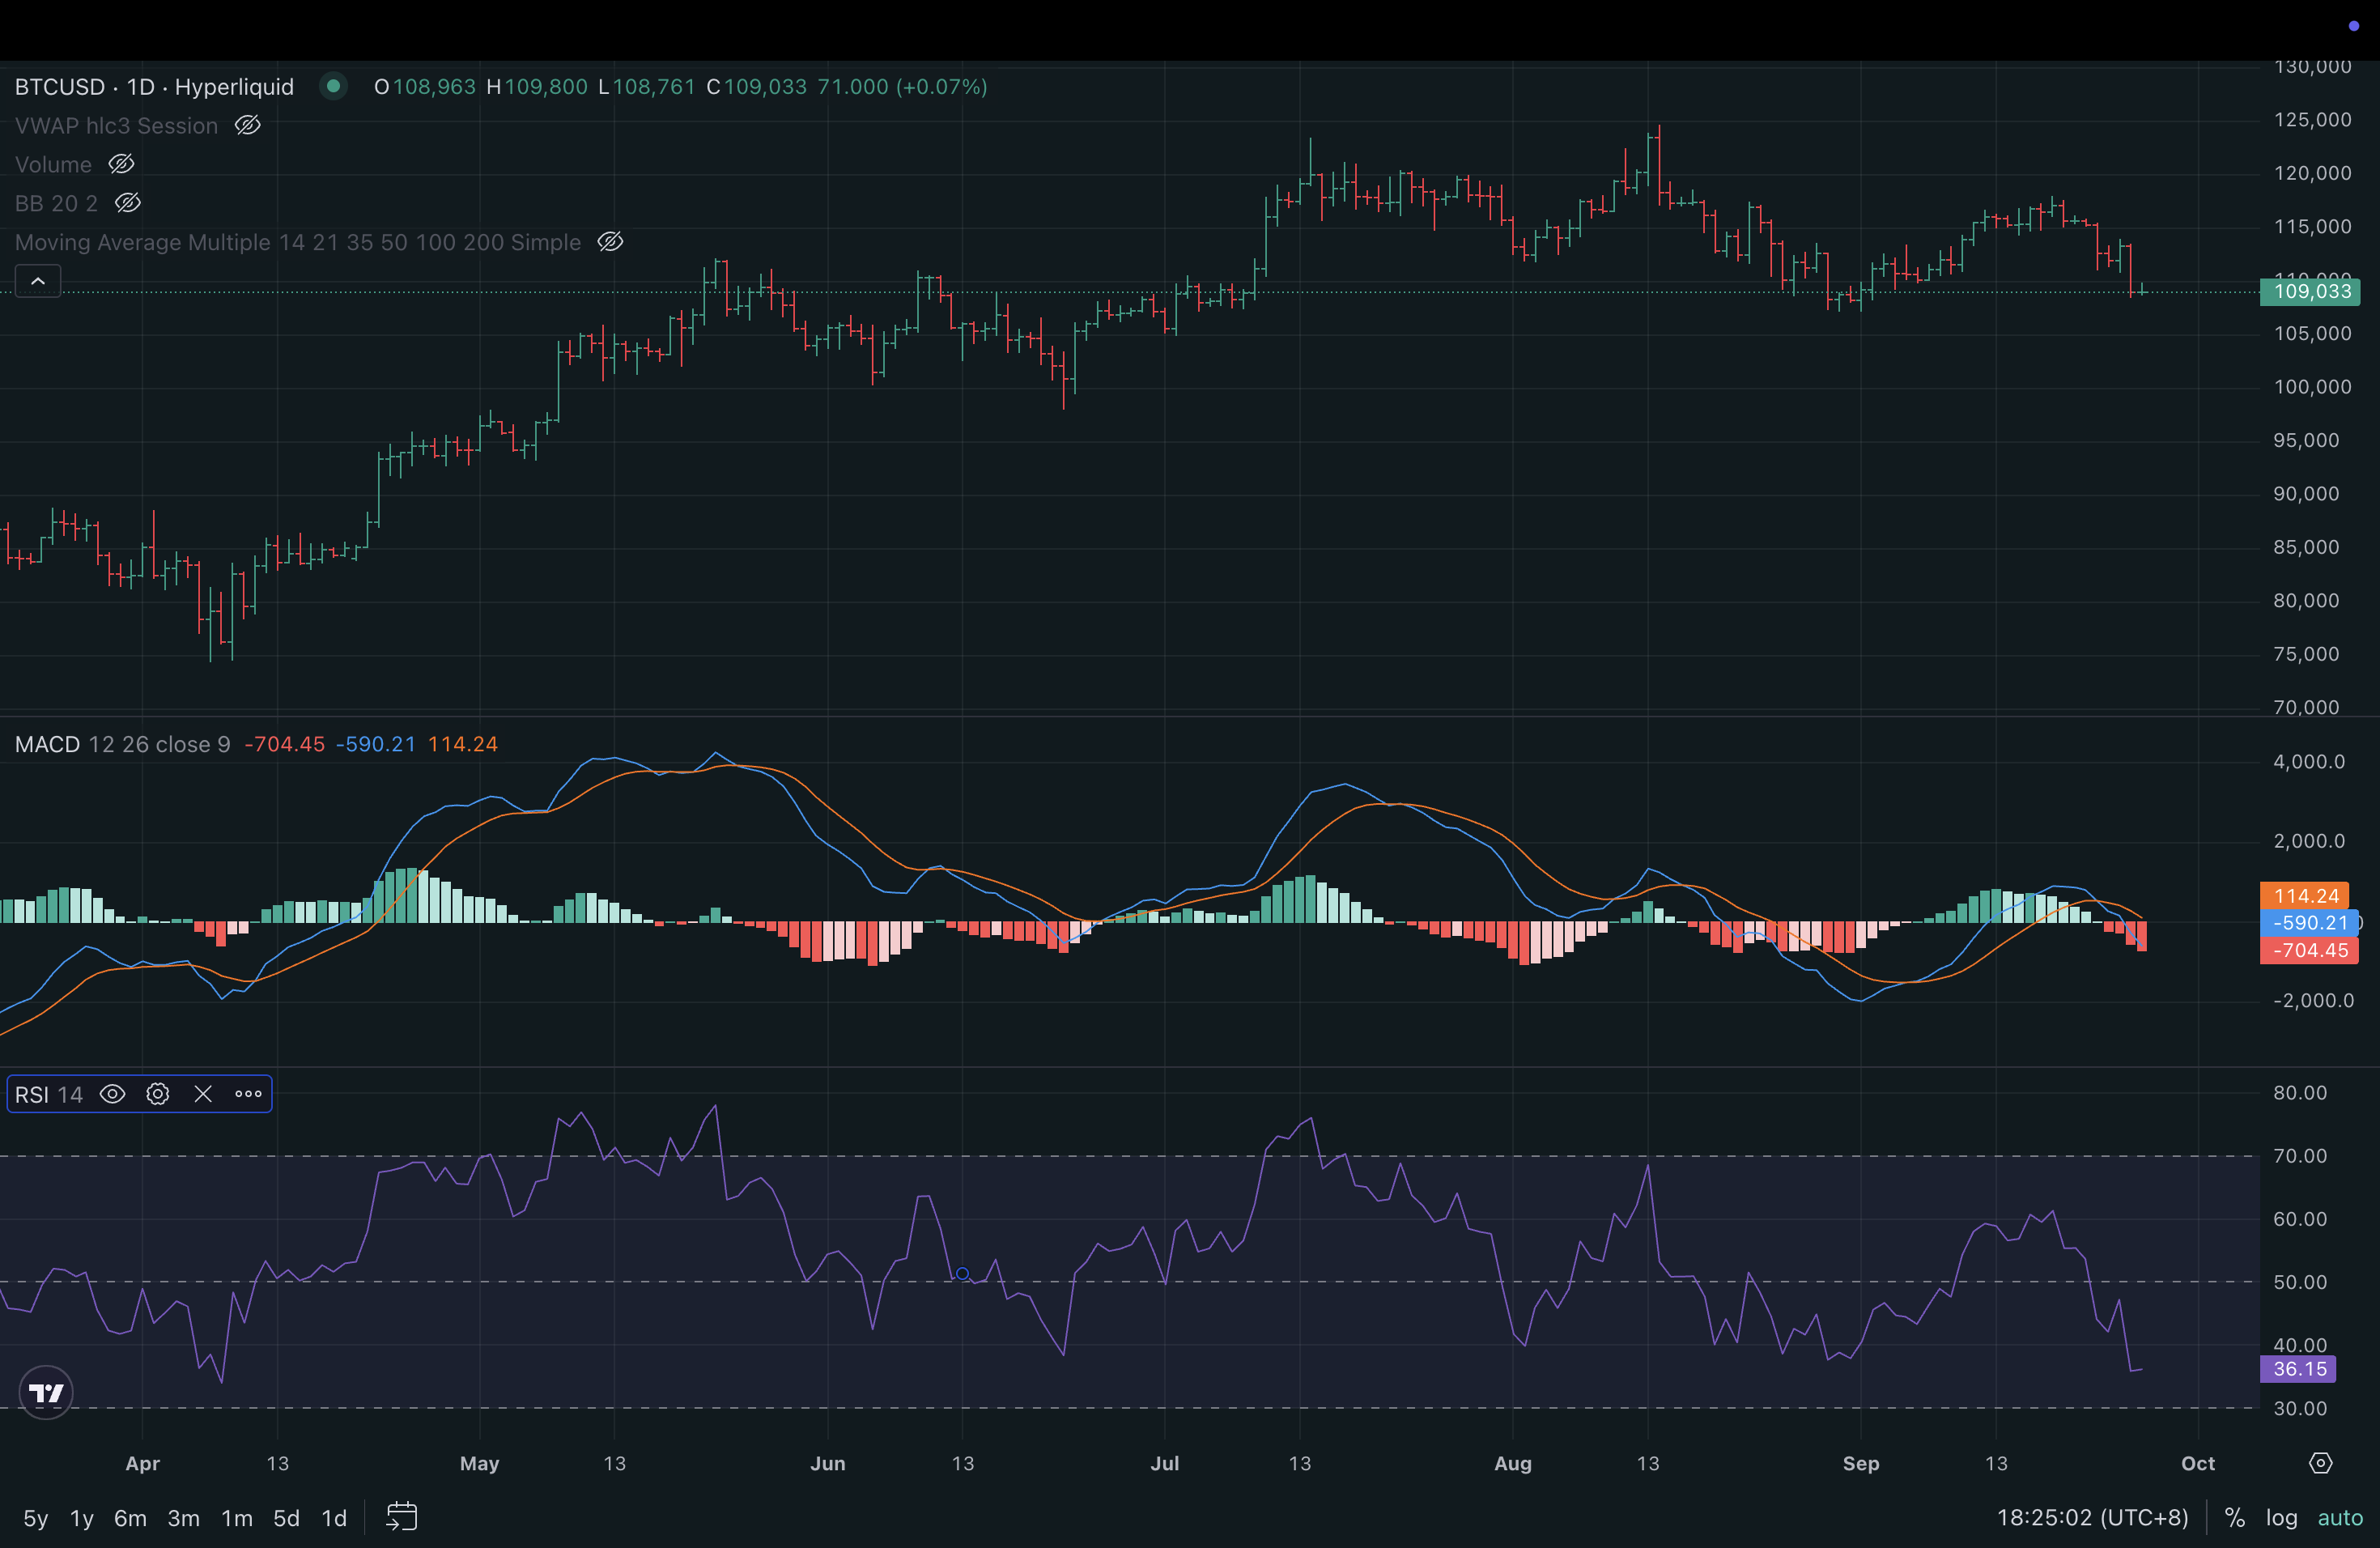
- MACD(12,26,9): bullish when MACD line crosses above signal and preferably above 0; bearish when it crosses below and/or below 0.
- RSI(14): bull bias when above 50, bear bias below 50. Use 40–60 as a trend ribbon; 30/70 are exhaustion zones. Divergences warn of reversals.
Core combo strategy (rules you can copy)
Trend filter
- Use a 200 EMA on price to avoid choppy ranges.
- Longs only if price closes above 200 EMA.
- Shorts only if price closes below 200 EMA.
Entry (on candle close)
- Long:
- MACD line crosses above Signal AND histogram ≥ 0
- RSI crosses above 50 (ideally rebounding from 40–50 zone)
- Short:
- MACD line crosses below Signal AND histogram ≤ 0
- RSI crosses below 50 (ideally rolling down from 50–60)
Stops and targets
- Initial stop: 1.5×ATR(14) beyond entry or beyond the last swing.
- Take profit:
- Scale at +1R; trail remainder with 2×ATR or the 20 EMA.
- Or exit on opposite MACD crossover or RSI crossing back through 50.
Optional confirmations
- Multi-timeframe: trade on 1H/4H only when the higher timeframe RSI is on the same side of 50 and MACD histogram agrees.
- Zero-line rule: favor MACD signals near or crossing the zero line—often stronger trends.
When to avoid
- Price pinned near the 200 EMA (range).
- Major event risk minutes before/after CPI, FOMC, NFP, ETF decisions.
Cheat sheet (at-a-glance)
| Condition | Long | Short |
|---|---|---|
| Trend (200 EMA) | Close above | Close below |
| MACD | Cross up, histogram ≥ 0 | Cross down, histogram ≤ 0 |
| RSI | Crosses above 50 (prefer 40→50→up) | Crosses below 50 (prefer 60→50→down) |
| Stop | Entry − 1.5×ATR or under swing | Entry + 1.5×ATR or above swing |
| Exit | +1R scale, trail; or opposite cross | +1R scale, trail; or opposite cross |
Worked examples (hypothetical)
BTCUSDT, 4H
- Setup: Price above 200 EMA; MACD crosses up; RSI crosses 50 from 47.
- Entry: 62,800; ATR(14)=420 → Stop = 62,170.
- 1R target: 63,430; partial take profit; trail with 2×ATR.
XAUUSD (Gold), Daily
- Setup: Above 200 EMA; MACD cross up near zero; RSI 52 and rising.
- Entry: 2,360; ATR=28 → Stop = 2,318.
- Scale at 2,402; trail using 20-day EMA or 2×ATR.
Settings that work well
- Intraday (5–15m): MACD(24,52,9), RSI(14), 200 EMA; expect more noise.
- Swing (1H–4H): MACD(12,26,9), RSI(14); sweet spot for crypto and FX.
- Daily: Defaults or faster MACD(8,21,5) for earlier signals.
Add a high-probability pattern: divergence + trigger
- Bullish: Price lower low while RSI makes higher low; wait for MACD cross up and RSI reclaim >50.
- Bearish: Price higher high while RSI makes lower high; then MACD cross down and RSI <50.
Common mistakes
- Entering before candle close (signals can vanish intra-bar).
- Taking every RSI 70/30 reading as reversal—combine with MACD and trend.
- Oversizing; keep risk ≤1%.
- Ignoring higher-timeframe context.
Backtesting quick plan
- Pick a pair and timeframe (e.g., BTC 4H).
- Test 100 trades across market regimes.
- Track win rate, average R, profit factor, max drawdown, longest losing streak.
- Include realistic fees/slippage; use signals only at bar close.
This combined MACD + RSI approach leverages trend and momentum signals for more accurate entries and exits, improving risk management and reducing false alarms across diverse markets.