Appearance
Decoding the Market's Mood: A Beginner's Guide to the RSI
Have you ever wondered how traders try to predict whether a stock's price will go up or down? They use special tools called indicators, and one of the most popular is the RSI (Relative Strength Index). This guide will break down what the RSI is, how it can be used to build a trading strategy, and why it's a crucial part of risk management. Understanding the RSI is a great first step into the world of market analysis. A solid trading strategy often incorporates the RSI, and effective risk management is key to success.
What is the RSI?
The RSI, or Relative Strength Index, is a technical indicator that helps traders measure how quickly and by how much an asset's price is changing. Think of it like a speedometer for a stock's price. It tells you if the price movement is speeding up or slowing down. Developed by J. Welles Wilder Jr., the RSI is a momentum oscillator that measures the speed and change of price movements. The RSI is displayed as a single line that moves between 0 and 100. For any trading strategy involving the RSI, understanding this scale is fundamental. Good risk management dictates that you shouldn't rely on the RSI alone, but it's a powerful tool in your trading strategy toolbox.
How Does the RSI Work?
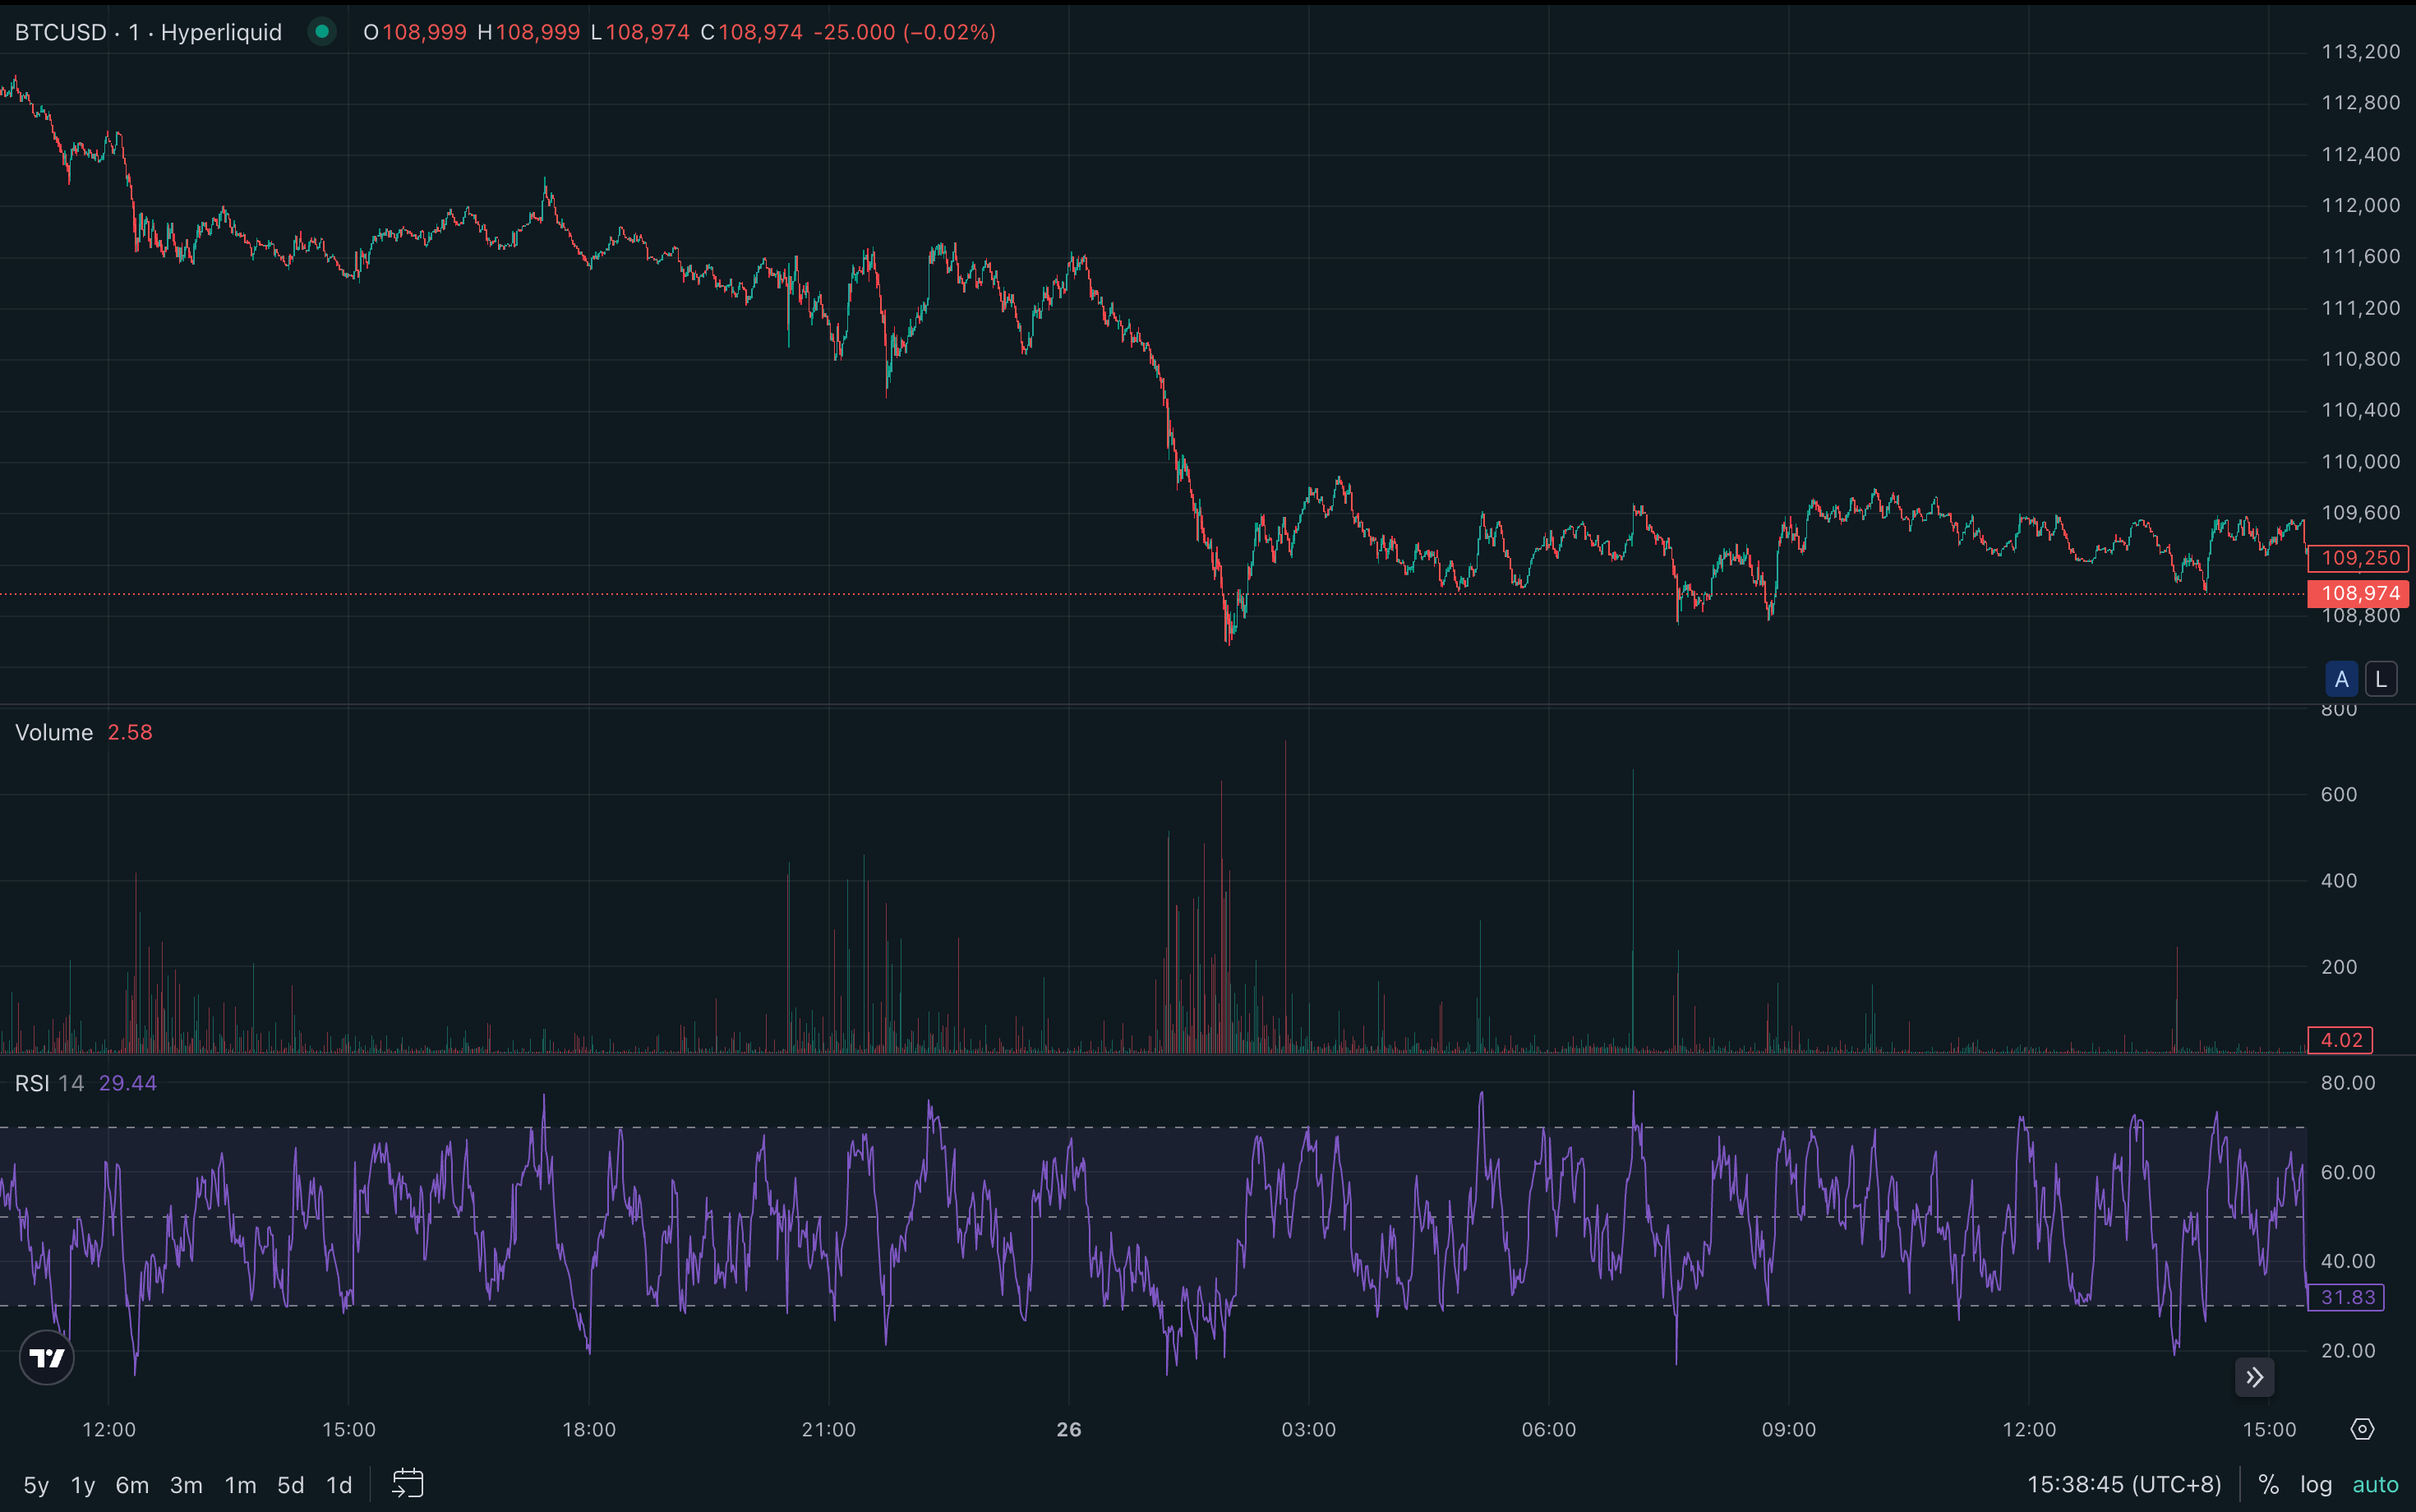
The RSI calculates the average gains and losses over a specific period, usually 14 days. It then plots this calculation on a scale of 0 to 100.
- When the RSI value is high (typically above 70), it suggests that the asset has seen a lot of positive price movement and might be "overbought."
- When the RSI value is low (typically below 30), it suggests the asset has seen a lot of negative price movement and might be "oversold."
This simple 0-100 scale makes the RSI a popular tool for developing a clear trading strategy. Incorporating these RSI levels is a form of risk management, helping you avoid buying at the peak or selling at the bottom. A successful trading strategy often defines specific RSI levels for entry and exit points as part of its risk management plan.
What Do "Overbought" and "Oversold" Mean in RSI Trading?
These are two of the most important concepts when using the RSI in your trading strategy.
Overbought (RSI > 70): When the RSI goes above 70, it's a signal that the asset may be overvalued because of a recent strong upward price move. This could mean a price correction or reversal is coming soon. In a trading strategy, this might be a signal to consider selling. Proper risk management would involve looking for other signs to confirm this before acting. An overbought RSI is a key component of many reversal trading strategy approaches.
Oversold (RSI < 30): When the RSI drops below 30, it signals that the asset may be undervalued after a strong downward price move. This could indicate that the selling pressure is easing and the price might be ready to bounce back up. A trading strategy might use this as a signal to consider buying. Again, good risk management means not relying solely on this one RSI signal. The oversold RSI is a core element for any dip-buying trading strategy.
Using these levels in your trading strategy is a fundamental aspect of risk management with the RSI.
How Can the RSI Be Part of a Trading Strategy?
The RSI is not a magic crystal ball, but it can be a vital component of a well-planned trading strategy. Here's a simple trading strategy idea using the RSI:
- Identify the Signal: Wait for the RSI to cross below 30 (oversold) or above 70 (overbought).
- Wait for Confirmation: Don't act immediately. If the RSI is oversold, wait for it to cross back above 30. This confirms the buying momentum is returning. If it's overbought, wait for it to cross back below 70. This confirms selling momentum is starting.
- Execute the Trade: Enter a "buy" trade after the oversold confirmation or a "sell" trade after the overbought confirmation.
- Practice Risk Management: Set a "stop-loss" order. This is an automatic order to sell if the price drops to a certain level, limiting your potential loss. This risk management step is crucial for any trading strategy, especially one using the RSI.
This basic trading strategy shows how the RSI can provide entry signals, but always remember that risk management is the most important part of trading.
What is RSI Divergence and Why Is It Important?
RSI divergence is a more advanced but very powerful signal. It happens when the price of an asset is moving in the opposite direction of the RSI.
- Bullish Divergence: The asset's price makes a new low, but the RSI makes a higher low. This suggests that the downward momentum is weakening, and the price might reverse to go up soon. This is a strong buy signal for an RSI based trading strategy.
- Bearish Divergence: The asset's price makes a new high, but the RSI makes a lower high. This indicates that the upward momentum is fading, and the price could be about to fall. This is a critical sell signal for a trading strategy focused on risk management.
Spotting divergence is a sophisticated trading strategy that can give you an edge and improve your risk management by helping you anticipate trend changes. A trading strategy that includes divergence is often more robust.
How Does the RSI Help with Risk Management?
Risk management is all about protecting your money. The RSI is an excellent tool for risk management in several ways:
- Avoiding Bad Entries: The RSI helps you avoid buying an asset when it's already overbought (high risk of a price drop) or selling when it's oversold (high risk of missing a rebound). This is the core of risk management in a trading strategy.
- Setting Stop-Losses: You can use RSI levels to help decide where to place your stop-loss orders, a key risk management technique.
- Confirming Trends: Using the RSI with other indicators can give you more confidence in your trades, which is a form of risk management. A trading strategy should never rely on a single indicator.
Ultimately, the RSI provides data that allows a trader to make more informed decisions, which is the foundation of any good risk management plan and trading strategy.
Conclusion: The RSI as a Tool, Not a Guarantee
The RSI is a versatile and valuable indicator for any trader. It helps identify overbought and oversold conditions, spot potential trend reversals through divergence, and forms the backbone of many trading strategy plans. However, it's crucial to remember that no indicator is perfect. Effective trading combines the signals from the RSI with a comprehensive trading strategy and strict risk management rules. By understanding how the RSI works, you can add a powerful tool to your analytical arsenal and make smarter, safer trading decisions. A successful trading strategy always balances potential rewards with careful risk management, and the RSI is a great help in finding that balance.