Appearance
The Ultimate MACD Crossover Strategy: A Step‑by‑Step Guide with Example
Overview
In the chaotic world of trading, clarity is king. Charts are flooded with dozens of indicators, each promising to unlock the market's secrets. But amidst the noise, one indicator has remained a favorite of traders for decades due to its simplicity and power: the Moving Average Convergence Divergence, or MACD.
This guide will break down everything you need to know. We’ll go from the basic components of the MACD to a step-by-step plan for executing the crossover strategy, complete with a practical example and common pitfalls to avoid. Whether you're trading crypto, stocks, or gold, this is a foundational strategy every trader should master.
What is MACD (quick refresher)
- MACD line = EMA(12) − EMA(26)
- Signal line = 9‑period EMA of the MACD line
- Histogram = MACD − Signal (positive when MACD is above Signal)
Why crossovers matter
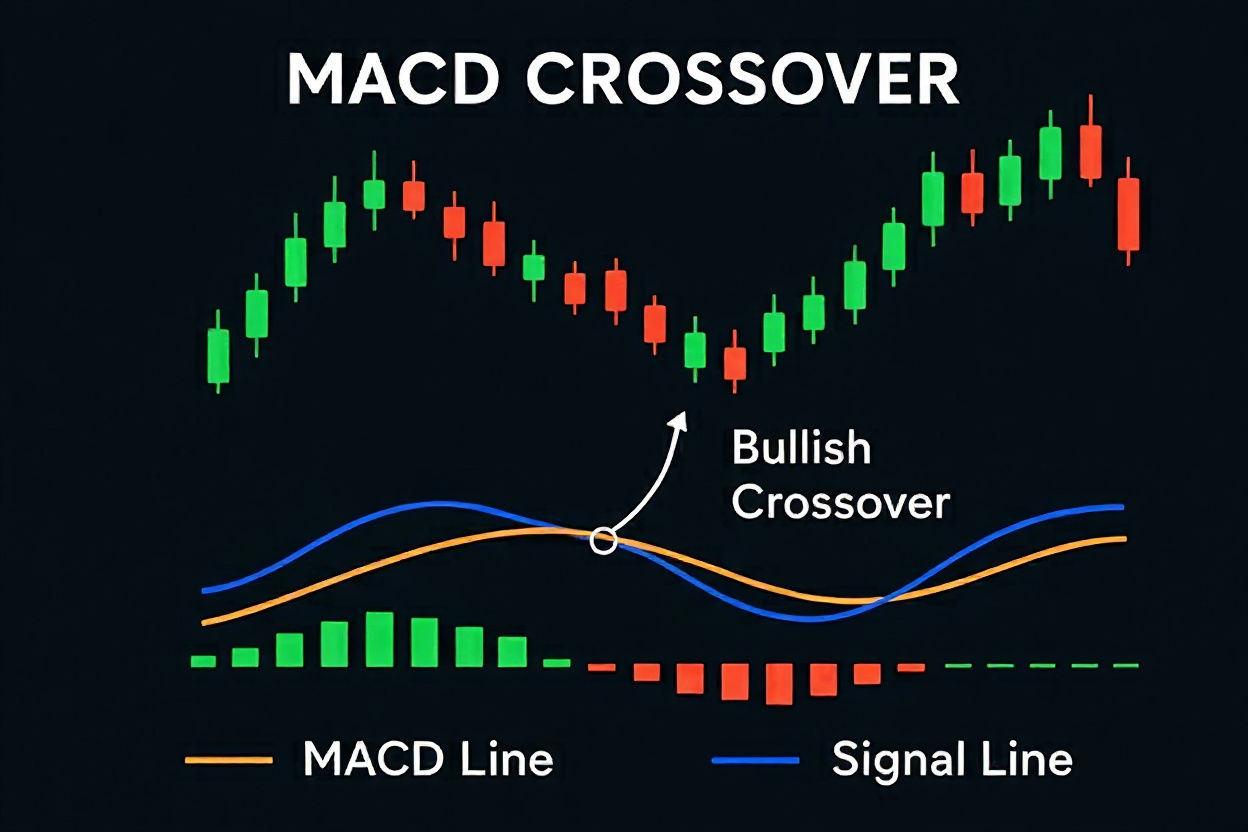
- Bullish crossover: MACD line crosses above Signal → momentum turning up.
- Bearish crossover: MACD line crosses below Signal → momentum turning down.
- Zero‑line cross (MACD crossing 0) often confirms trend strength.
 Figure: MACD crossover signals showing bullish crossover when MACD line (orange) crosses above Signal line (blue), with corresponding price action and histogram changes.
Recommended chart setup
- Indicator: MACD (12, 26, 9)
- Trend filter: 200 EMA on price (helps avoid choppy, range‑bound signals)
- Volatility tool: ATR(14) for stops/targets
- Timeframes:
- Crypto swing: 4H or Daily
- Gold/oil (RWAs): 4H or Daily
- Intraday scalping: 5–15m (use tighter settings and expect more noise)
Pro tip: For 24/7 crypto, slightly slower MACD can reduce whipsaws (e.g., 24/52/9 on 1H–4H).
The MACD Crossover Strategy (rules you can copy)
1) Market selection
- Trade instruments with healthy trend and liquidity (BTC, ETH, XAUUSD, WTI, major alt pairs).
- Skip low‑liquidity tokens that slip or gap on news.
2) Trend filter
- Longs only if price closes above the 200 EMA.
- Shorts only if price closes below the 200 EMA.
3) Entry trigger (on candle close)
- Long: MACD crosses above Signal AND Histogram flips from negative to positive.
- Short: MACD crosses below Signal AND Histogram flips from positive to negative.
4) Initial stop‑loss
- ATR stop:
- Long: Entry − 1.5×ATR(14)
- Short: Entry + 1.5×ATR(14)
- Alternative: below/above recent swing low/high.
5) Take‑profit and trade management
- Option A (R‑multiple):
- Take partial at +1R, move stop to breakeven, trail remainder to +2R or +3R.
- Option B (ATR target):
- Set TP at Entry ± 2×ATR; trail with 2–3×ATR.
- Option C (signal exit):
- Exit on opposite MACD crossover or when Histogram flips back.
6) Risk per trade
- Keep risk small: 0.5–1.0% of account per trade.
- Position size = (Account × Risk%) ÷ (Entry − Stop distance).
7) Multi‑timeframe confirmation (optional but powerful)
- Trade on 4H if Daily MACD Histogram is aligned (e.g., positive for longs).
- This filter can drastically reduce false signals in chop.
Worked examples (crypto and gold)
Example A: BTCUSDT on 4H (hypothetical numbers)
- Setup:
- Price above 200 EMA (uptrend).
- ATR(14) = $420.
- Bullish crossover occurs at candle close, Entry = $62,800.
- Risk:
- Stop = 62,800 − 1.5×420 = 62,800 − 630 = $62,170.
- Risk per BTC = $630. If risking $300 per trade → size ≈ 0.476 BTC.
- Management:
- 1R target = 62,800 + 630 = $63,430.
- At $63,430 take partial (e.g., 50%), move stop to breakeven.
- Trail remaining using 2×ATR or hold until a bearish crossover.
Example B: XAUUSD (Gold) on Daily (hypothetical numbers)
- Setup:
- Price above 200 EMA.
- Bullish MACD crossover at $2,360; ATR(14) = $28.
- Risk:
- Stop = 2,360 − 1.5×28 = 2,318.
- 1R = $42. If risking $420 on the trade → position ≈ 10 oz.
- Target:
- Partial at $2,402 (1R), trail remainder by 2×ATR ($56) or exit on bearish crossover.
When to avoid MACD crossovers
- Flat markets with price pinned around the 200 EMA.
- Low‑volume hours or into high‑impact news (CPI, FOMC, ETF decisions).
- Assets with frequent gap risk (thin books, illiquid pairs).
Settings cheat‑sheet (starting points)
- 5–15m: MACD(24, 52, 9), 200 EMA, ATR(14)×1.5–2.0
- 1H–4H: MACD(12, 26, 9), 200 EMA, ATR(14)×1.5
- Daily: MACD(12, 26, 9) or slightly faster (8, 21, 5) for earlier signals
Performance tips and variations

- Zero‑line confirmation: Favor signals that cross the zero line soon after the crossover.
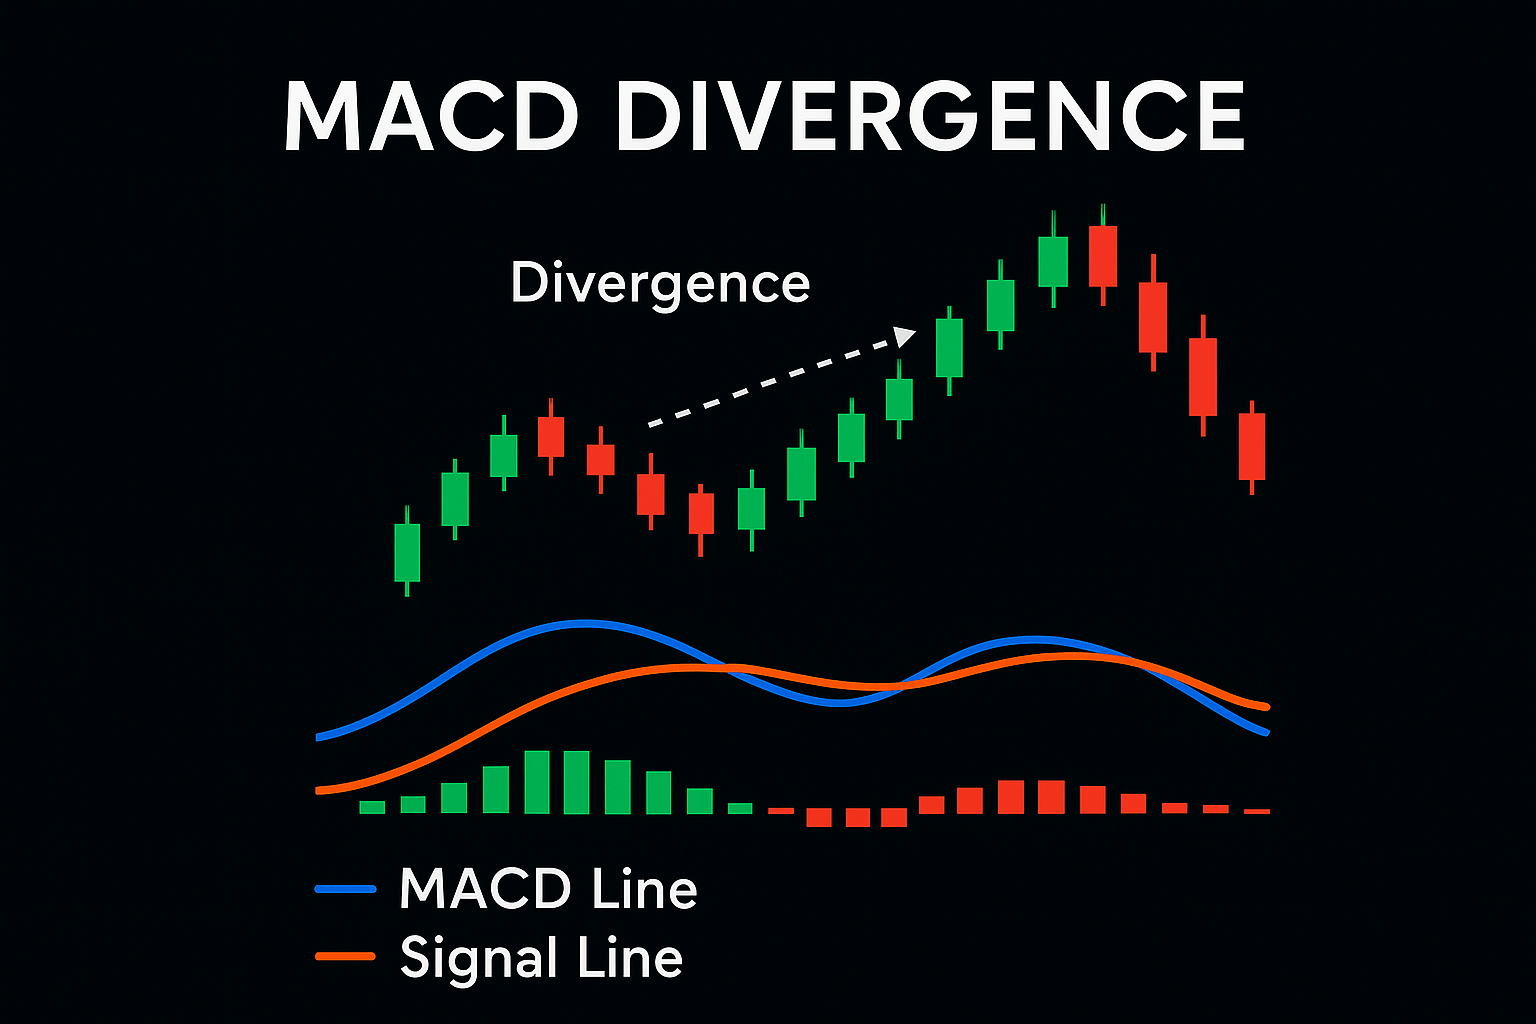
- Divergence add‑on: Look for bullish divergence (price lower low, MACD higher low) for longs; bearish divergence for shorts.
- EMA pullback entry: After the crossover, buy the first pullback to the 20–50 EMA.
- Position pyramiding: Add on subsequent higher‑low MACD Histogram pullbacks while above 200 EMA (advanced).
- Volatility filter: Skip trades when ATR is in the bottom 20% of its 6‑month range.
Common mistakes to avoid
- Entering before candle close (the crossover can disappear intra‑bar).
- Ignoring the higher‑timeframe trend.
- No fixed stop or oversized position.
- Taking every crossover in a range—use the 200 EMA and ATR filters.
- Over‑optimizing MACD lengths to past data (curve‑fitting).
Backtesting outline (fast and realistic)
- Sample: At least 100 trades across two market regimes (trend and range).
- Metrics to track: win rate, average R, profit factor, max drawdown, longest losing streak.
- Guardrails:
- Use candle‑close entries only.
- Apply realistic fees and slippage.
- Perform walk‑forward: train on period A, test on period B.
Quick checklist before you click “Buy”
- Is price clearly above/below the 200 EMA?
- Did the MACD crossover confirm on candle close?
- Is ATR not unusually low (avoid dead markets)?
- Have you sized the trade to ≤1% risk?
- Do you have a plan for partial profit and trailing?
FAQ
- Is MACD better than RSI? They measure different things; MACD is momentum/trend, RSI is overbought/oversold. Many traders combine them.
- What timeframe works best? 4H and Daily tend to reduce noise in crypto and RWAs. Intraday requires stricter filters.
- Can I automate this? Yes—use the provided Pine Script as a starting point and refine risk rules.
Final notes
MACD crossovers shine in trending phases and can be lethal in ranges. Pair the signal with a trend filter (200 EMA), volatility‑aware stops (ATR), and strict risk management. Test, iterate, and only scale once your stats are stable.
This is educational content, not financial advice. Trade responsibly.